Businesses certainly all strive for reliable, sustainable growth- and it is usually well within the reach of most of them. Simply put, it requires developing a process driven, quantitative, highly measurable sales process (emphasis on process) no matter what the industry or market situation. A number of organizations today are using the term Sales Engine to describe this tried and true model. It’s not new, it does work, and the tools for implementation are much improved and getting better every day.
The first introduction for me to the sales engine model was in 1990. I had just taken a position as the VP of Sales & Marketing for a subsidiary of Eastman Kodak. We were introducing what was at the time a revolutionary new system for digitally composing pages for publication. It was the first “open system” platform of it kind. We had very high expectations for market penetration and our business plan called for us to place more systems in our first two years than the current market leader. We had to hire, train and equip a new sales force in less than 12 months, and beat the competition in system placements in year one. Dock Square Consultants had been hired to help us build a sales engine that turned out to be the critical success factor for us in achieving the lofty goals. More on this later…
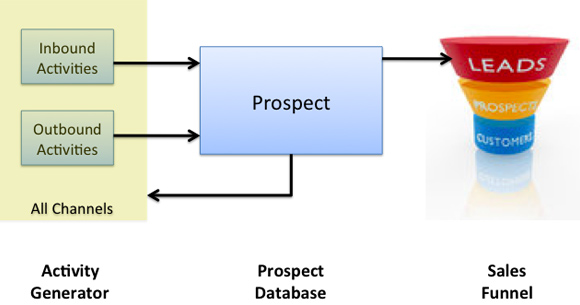
The classic “database centered” sales engine has 3-parts.
- Activity Generator where inbound and outbound marketing activities generate leads through marketing communications programs, or even through “cold-calling” using all available channels
- Prospect Database that contains the target market database for the product or services
- Sales Funnel that is used to manage the sales process once a “lead” is generated.
Regardless of the tools employed (websites, CRM, e-blasts, blogs, etc.) in the sales engine, the basic model remains the same. It is the rigor, quantitative measurement and process-management of the sales engine that creates sustainable growth.
In 1990, we did not have websites; and CRM’s were very large, expensive and cumbersome systems. We used the tools available to us at the time. They were rough but adequate- it was our company-wide commitment to using the sales engine process that made the difference, not the tools. Everyone on the customer facing side of our operation was involved, especially the sales team. We made it a condition of employment for the sales organization, and we also made it profitable for them in the commissions and bonuses as they achieved results.
There was predictability in the model. We could pace lead generation, we knew when we needed to hire more sales or more support staff, we learned the profile of the best prospect and used that to update the database, we could effectively forecast sales, schedule installations… all because we measured and managed each step of the process. We knew where the bottlenecks were before they became bottlenecks. Dock Square set up the engine, but our sales leaders managed it- everyone owned it.
We started with a database of prospect names that were then pre-qualified by a telemarketing team equipped with a qualification questionnaire. Before we placed a sales rep in a territory, we generated 50 highly qualified leads in the territory to help the rep get started, and then continued to drive lead generation. We measured every step in the sales cycle at weekly sales reviews, and posted results of each of the sales rep’s activity and results. We set up a “war-room” and measured all activity not just wins and losses , because the right activity leads to sales. Of the 12 very-senior-sales exec’s hired only one fell out due to lack of performance in that first year.
In case you are wondering, we met our sales goals in both the first and second years of operation. We were so successful that many of our team were promoted and moved onto larger areas of responsibility- myself included. We carried the model with us into our new assignments because we believed in it and because it worked.
While there are always many variations on the sales-engine theme to accommodate the uniqueness of different businesses, the model remains the same. As I said earlier, the tools are certainly much better today which makes implementation more cost effective and faster. Sustainable business growth creates value. At the heart of growth, is a strong functioning sales engine.

 Changes to the management team were needed that largely involved reassignment of senior staff, although there were a couple key new hires and terminations as well. The second action was to right-size the organization and consolidate facilities- always a painful step, but necessary. The third action was a very important one, and that was to impose financial discipline and financial decision-making. Previously, major decisions were made without financial analysis or justification. The newly appointed CFO took this one on successfully.
 Phase 2 then became the Market Focus phase. We took two significant actions in this phase- the first was to align our business in the way customers saw us and not how we saw things internally. We aligned as many of our resources as possible around our customer segments. In doing so, we improved our sales dramatically, but we also learned what was missing in our products and services. We immediately launched product development programs to strengthen our offerings- this took more than a year to accomplish. But, once we did, sales improved further yet.
 What had to be done was obvious on the one hand, but very difficult to do on the other- we had to better control our channels to market. The action we decided upon was to acquire a significant channel player with global sales and service capability, and a strong market presence.